
11 Aug 11th August 2025
Index Movement Last Week
| S&P500 | +2.4% |
| Nasdaq | +3.7% |
| Aussie ASX200 | +1.7% |
Last week the S&P500 ended just shy of its all-time high and the Nasdaq finished with a new all time high. Clearly traders are not concerned about tariffs, or inflation, or recession. And neither should you.
Now that earnings season is drawing to a close we can see why traders are so confident. Q2 earnings season has been so strong that Wall Street analysts are raising their 2025 S&P 500 earnings estimates. This is highly unusual. Most of the time they lower their yearly forecasts as each season progresses, but earnings have been so strong this time they are predicting even better performance for the rest of the year.
To get a sense of which sectors are driving this, we turned to FactSet and this chart
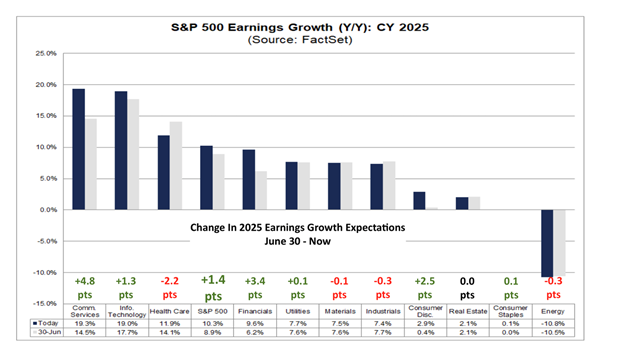
Analysts have made the big increases to Communication Services, Financials, Consumer Discretionary and Tech. But remember Comms Services includes Google, Facebook and Netflix, so is really just more Tech.
All this data does is confirm to us the best place to be is heavy US tech. In fact, it is hard to find an argument to do anything else.
So companies are thriving and generating lots of profits. What about the economy as a whole? Tariffs were supposed to be a problem. But they are not. In fact, as a whole the economy is looking very healthy.
This series of charts will help explain what is going on
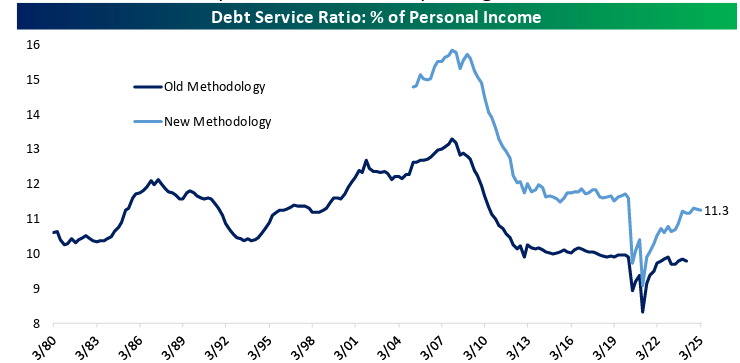
The US economy is driven mainly by consumers buying goods. Interest rates went up and the Fed has been on hold for some time, much to the chagrin of Mr Trump. But this chart shows that households are easily servicing their debt, despite rates being higher than pre-Covid levels. Consumers still have available cash to spend on discretionary items.
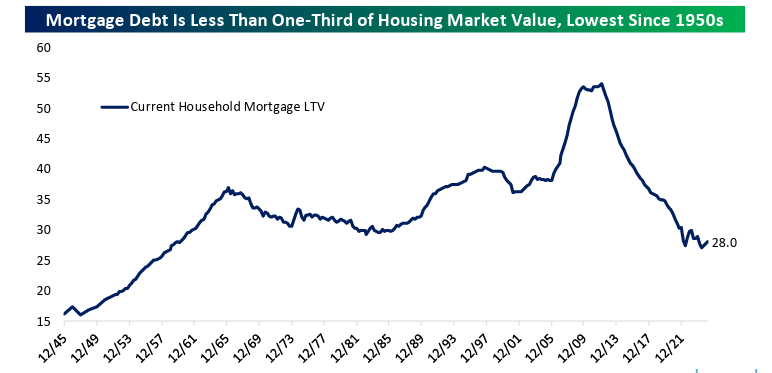
Outstanding mortgage balances are just 28% of the value of residential real estate owned by households, which creates a safety net that can unlock liquidity via sales of homes or borrowing and can boost confidence to spend
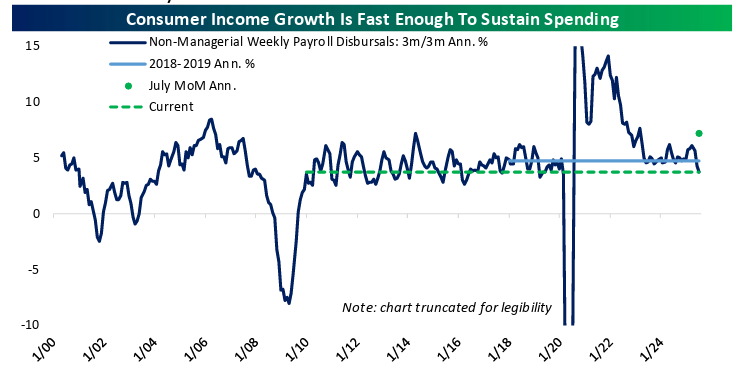
On top of low debt servicing, income growth is enough to fast enough to sustain spending. Despite coming down from post covid levels, the +7% print in July shows a consumer with an increasing ability to spend
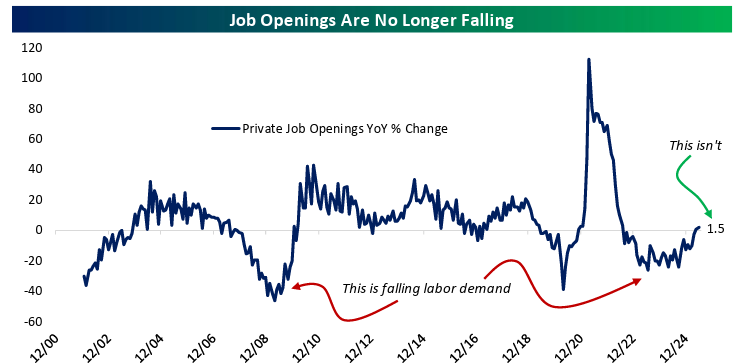
Recent fears of labour market weakness are overdone. Open openings have fallen, but they are actually higher than a year ago. Demand for labour would appear to be accelerating and not decelerating as this months jobs numbers had everyone fear.
Lastly, productivity is also improving which is a key measurement in the strength of the labor force
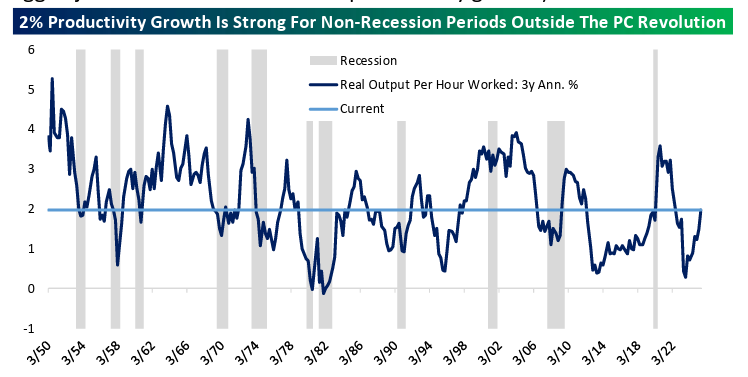
All up these charts paint the picture of a strong consumer and labour market. That drives the rest of the economy. So much so that tariffs are having little impact. Combine strong earnings growth with a strong consumer and you can see why stocks should be at all time highs. And likely will go higher by the end of the year
As I am on a roll with my charts, check this one out. It is spend on building new data centres
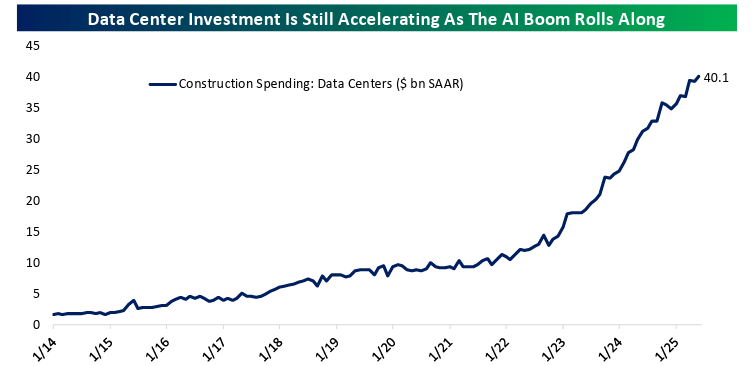
The AI boom is just getting started and will be an investment theme for the next decade. How much exposure to it do you have, as I bet it isn’t enough.
Warning
Stock values can go down as well as up. It is possible to lose 100% of your investment in a stock. Any advice given by Capital 19 is general advice only and does not take your personal circumstances into account and might not be suitable for you.